Style Chromatics
Experiments in abstracting visual information
BRIEF
This project was initially for an information design studio class. The concept was to consciously collect personal data for 5 weeks and use it to create a humanist data experience. I wasn’t satisfied with my initial solution, so I kept collecting and exploring the data. Over the past 15 months, the project has evolved into a space where I could experiment with the ideas and technologies that I find most exciting in the field.
DATA
I have written down what I wear every day since October 5, 2020. Each item has a set of properties, both intangible (brand, category, whether it was a new purchase) and visual (colors). As I explored different stories I could tell with this data, I kept coming back to the idea of abstracting my own material culture to discover larger patterns. This project explores the creation of derived data from visual properties.
DELIVERABLE
Interactive exploratory environment
Visual Abstraction
To collect the visual data, I scanned every item that I wore and pulled representative color data for my entries - 5 colors that became an abstracted symbol for each item.
The multiple items that form an outfit could be recombined into a single object - an abstract impression of what I wore that day.
Discovery Through Reorganization
The building blocks that form this impression can be reorganized along different scales to reveal different facets of the data.
These daily combinations worked well enough. But an entire week of these were too varied to produce any discernible patterns.
By breaking each day into its individual blocks of color and recombining them along a single scale, I could derive new data through this aggregation: a weekly cadence of colors.
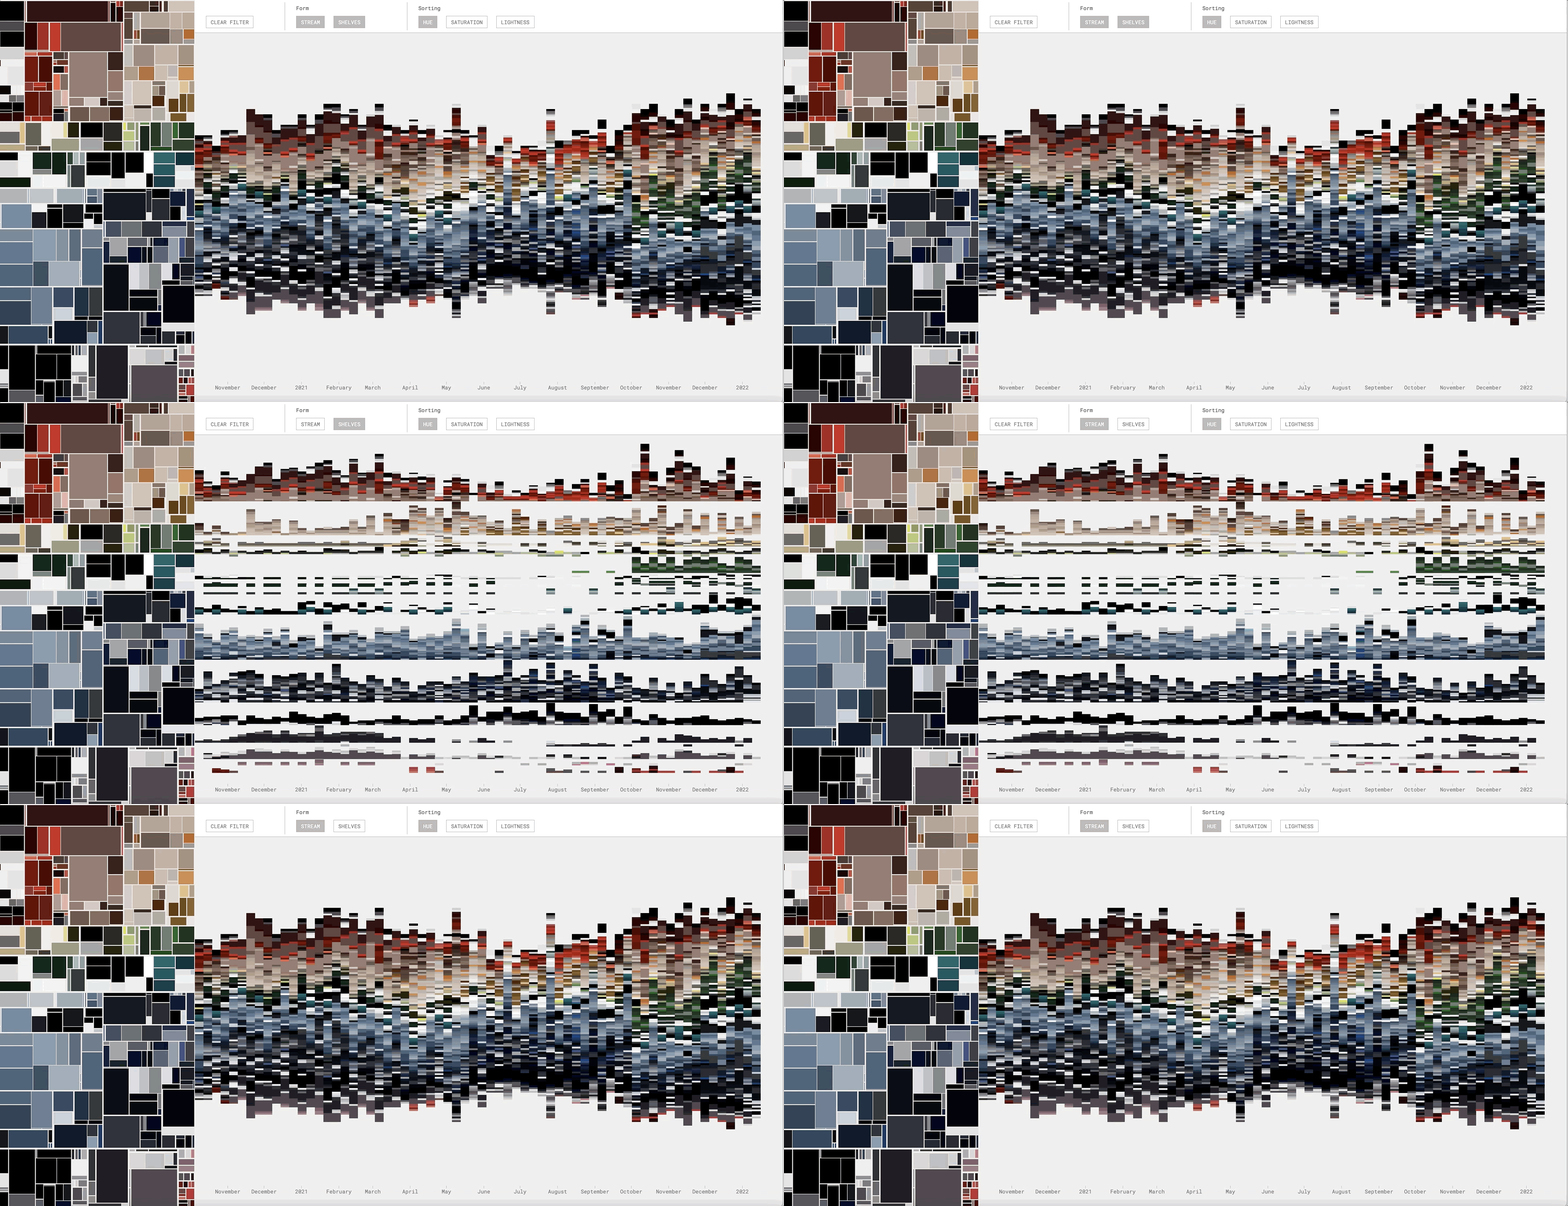
This spectrum can be reorganized along different distribution scales.
Interconnected Visualization System
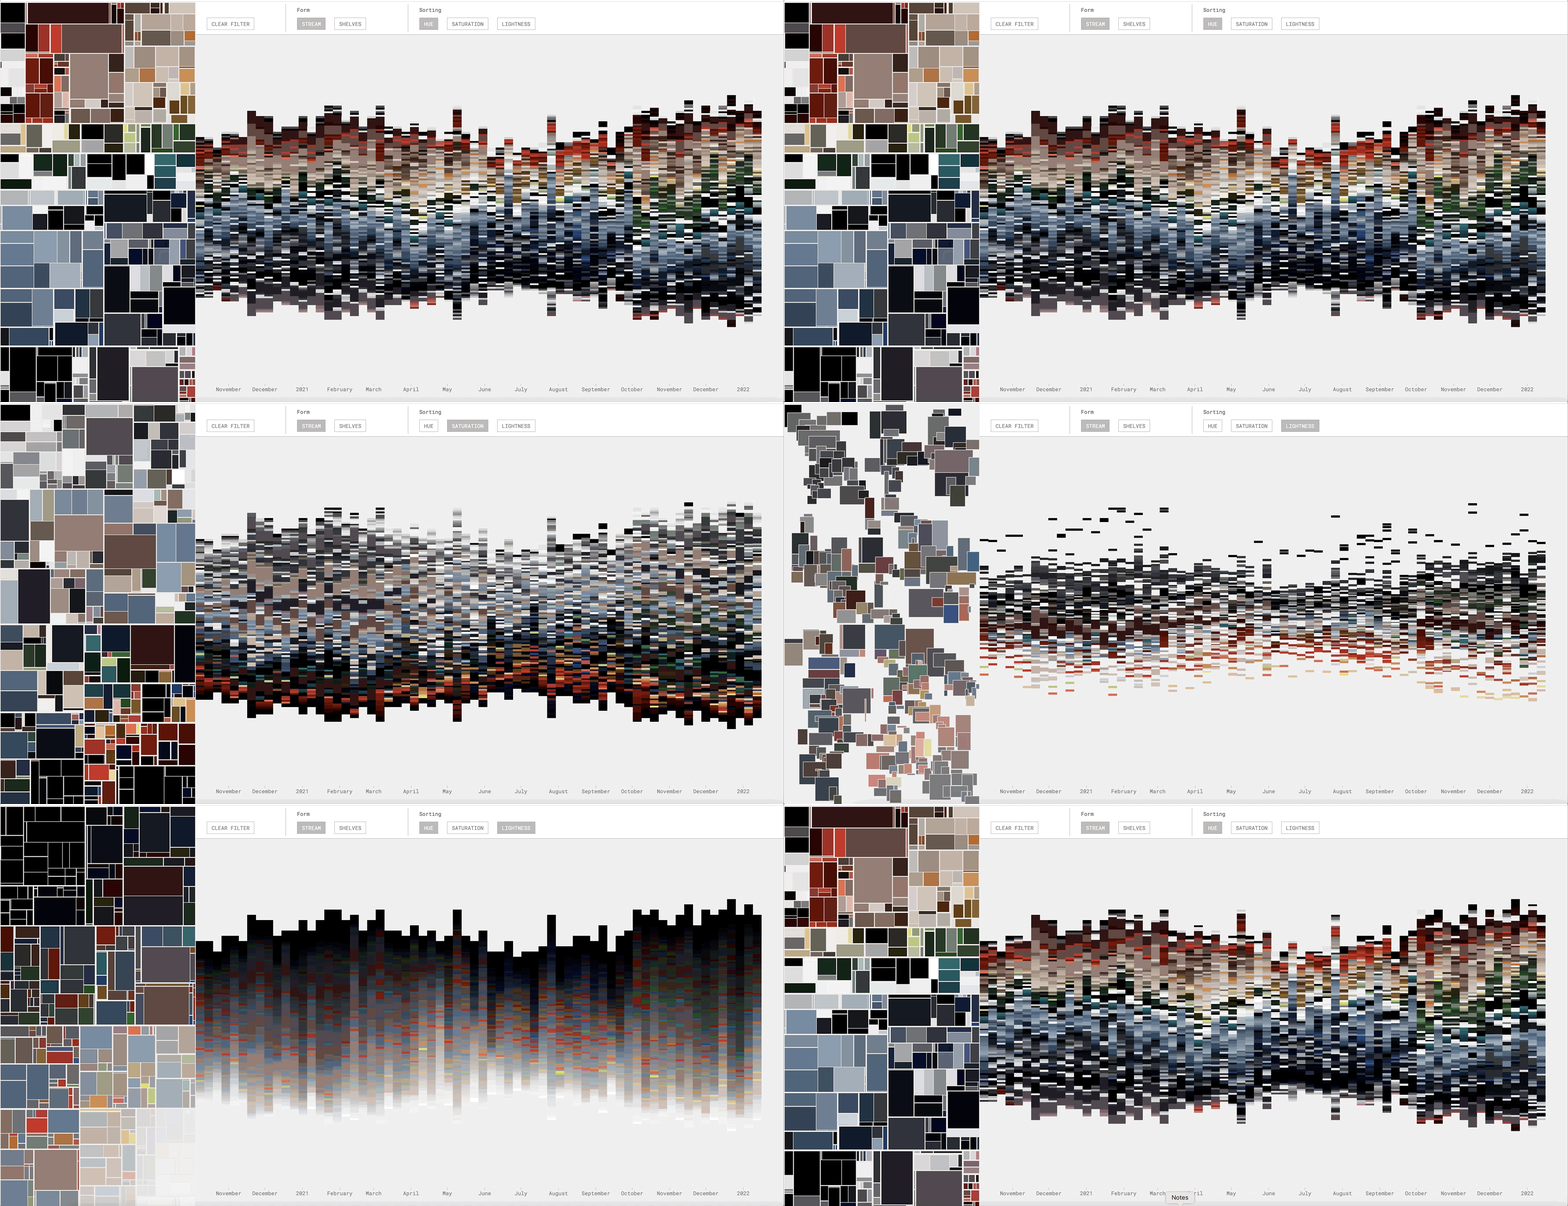
The main visualization is a timeline of weekly color spectra. Color bands are vertically centered to bring similar blocks of color closer to each other, reducing noise.
A treemap summarizes every instance of each color, exposing a nested hierarchy based on the same scale as the timeline.
Together, these visualizations form an interconnected system, in which actions taken on one impact the other and transform the entire space. In this case, setting the sort order of the timeline to saturation also redefines the hierarchy of the treemap.


