A Brief History of my Adult Life
Charting the evolution of my personal style
BRIEF
This project was for an information design studio class. The concept was to consciously collect personal data with the hope of understanding ourselves better. I am fascinated with personal style and framed this project as a tool to evaluate my wardrobe and reduce it to a capsule of pieces I consistently want to wear.
DATA
I itemized every piece of clothing I owned that contributed to my sense of personal style (excluding PJs, work-out clothes, camping stuff, socks, and intimates) and cross-referenced that data with a log of everything I’ve worn. The wear log data starts from the beginning of October 2020, which is when the project began. Because I have lived in so many different places, each of which contributed to my sartorial preferences, I organized the data according to the eras of my adult life.
Variables from my wardrobe data range from the type of garment to its physical qualities (primary and secondary colors, silhouettes) and when I added it to my closet.
DELIVERABLE
A humanist data experience
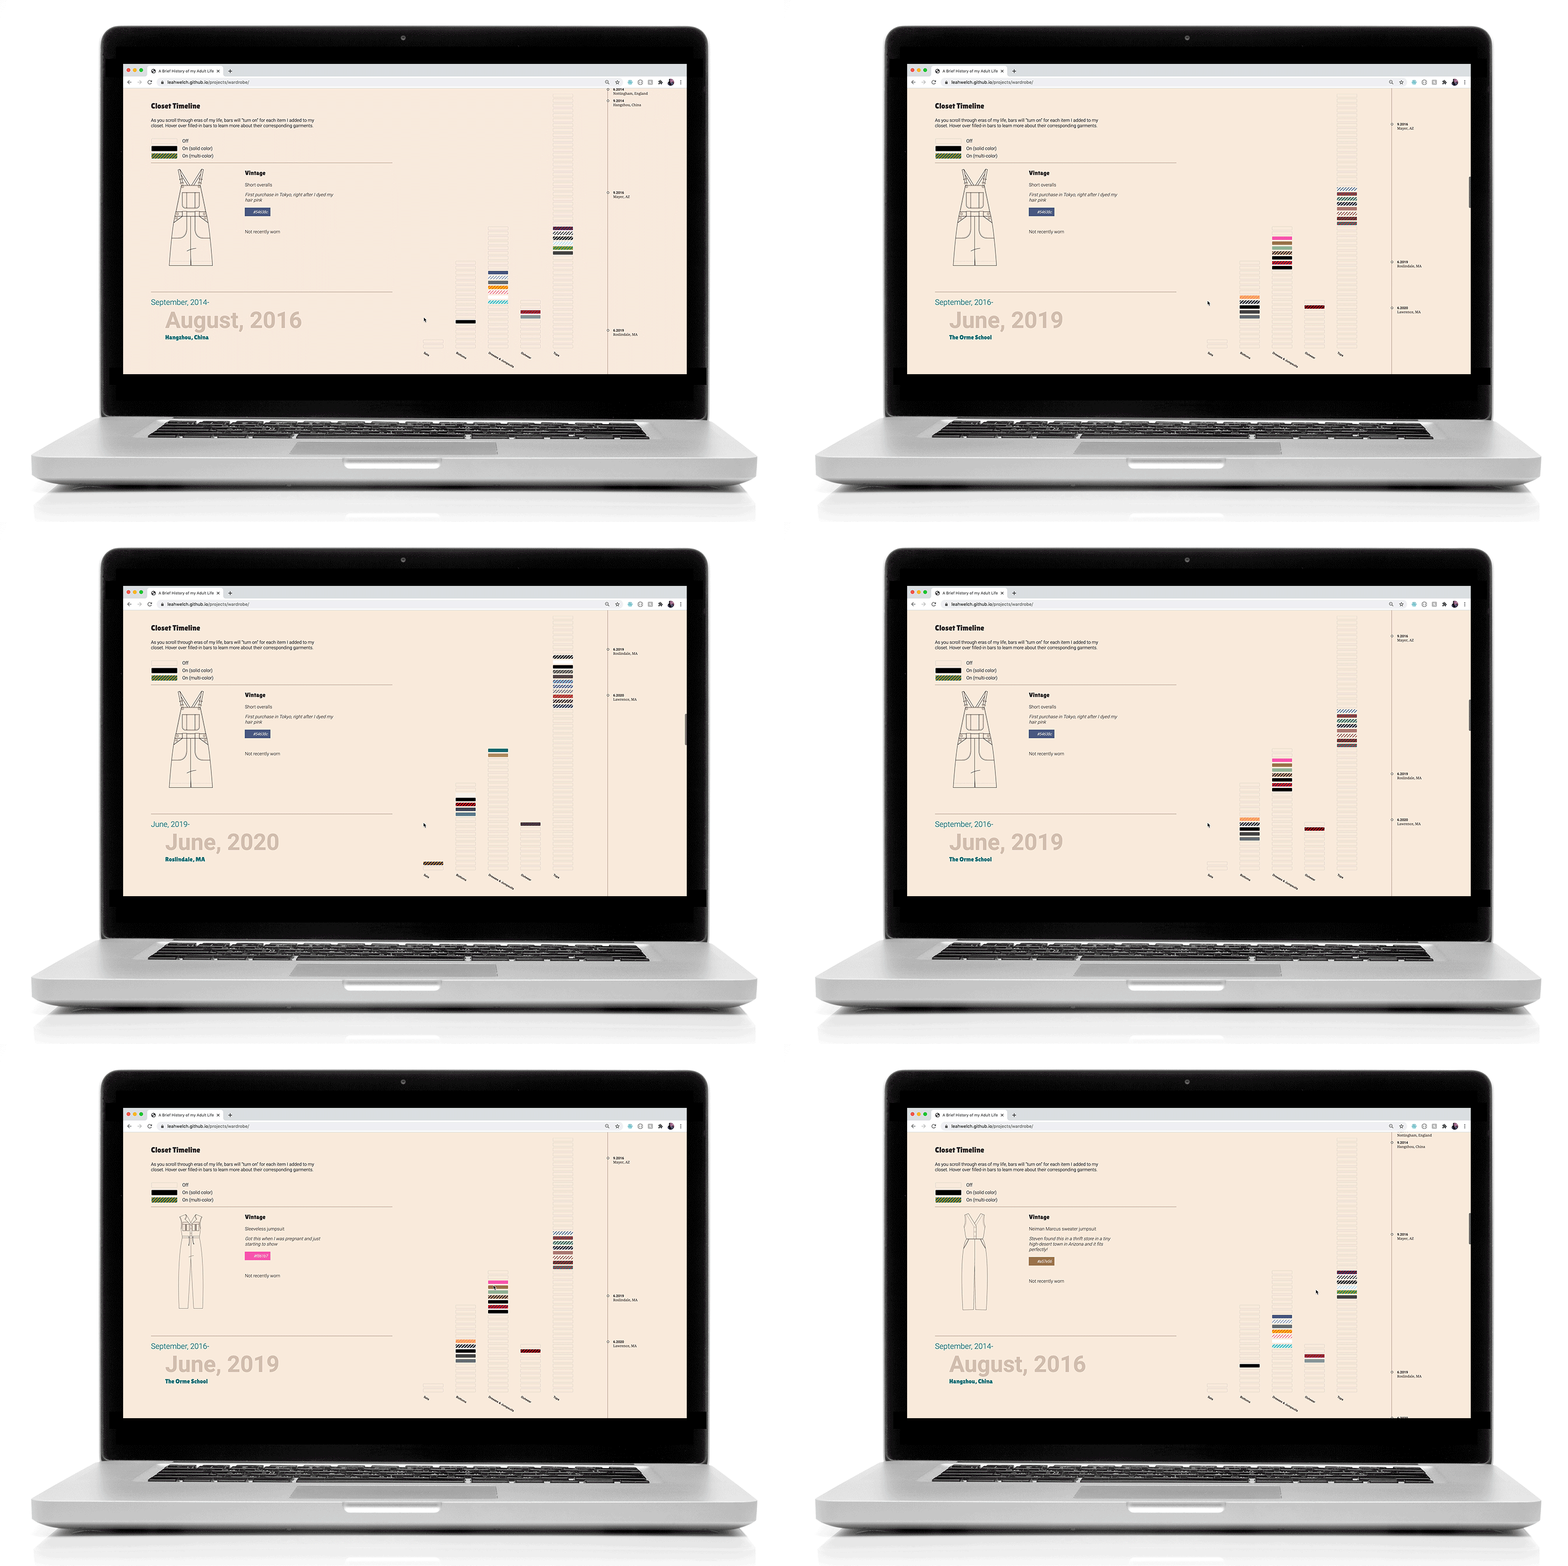
The top portion of the data story is a scrolling timeline through different eras of my life. As the user scrolls down through time, items I purchased during the “active” era fill in with their color or pattern and become interactive. I created both scrolling sections of this project using graph-scroll.js.
When the user mouses over a bar, the annotation section on the side fills in with the corresponding garment’s profile. If I wore the selected item in the past 3 months, a heatmap-style calendar appears in the annotation.
An analysis of my changing shopping habits visualizes the binary variables of whether an item was a vintage purchase or an online purchase. Sorted by year, I can plot the high points of my interest in thrifting and the rapid rise of my online shopping habit, accelerated by my discovery of shopping blogs and the COVID-19 quarantine.
To capture the uniqueness of each clothing item in my closet, I visualized the data in a stacked bar structure in which each bar represents 1 garment. I used different categorical structures to sort the stacks, invoking the visual metaphor of piles of folded clothes.
In the final component of the data story, I sorted my clothing by category and then separated worn and unworn items. Since this project motivated me to start cleaning out my closet, I wanted to track how my closet efficiency increased after I made my first round of discards.
Assets
When I started working on this project, I knew that I wanted to draw every item in my closet as part of the data collection process. Since I studied commercial fashion design, my ability to quickly generate illustrations in a “technical flat” style far outweighed my photographic capabilities.
For the 5 weeks of the project, I drew 4-6 pieces each night. Beyond the satisfaction of creating a snapshot of my closet during this time of my life, this exercise deterred me from making indulgent purchases, since I knew I’d have to draw them.
Since 52% of my clothing is either patterned or has a graphic element, I designed individual SVG pattern swatches for each non-solid item and applied these as the fills for the bars.
I generated unique “Pattern IDs” for each patterned item and used them to link the data points to the SVG images.


